it is, i can do some of it, labeling up etc
but just not all

 Senior Member
it is, i can do some of it, labeling up etc
but just not all
Eat Sleep Lase Repeat
Senior Member
ok, i think i misunderstood (language barrier)
Senior Member
its ok i went to college today, the tutor helped a bit and a few people helped so im now sorted.
many thanks guys
now maths........
fook me its like rocket science!!
Eat Sleep Lase Repeat
Senior Member
anyone a maths expert on here?
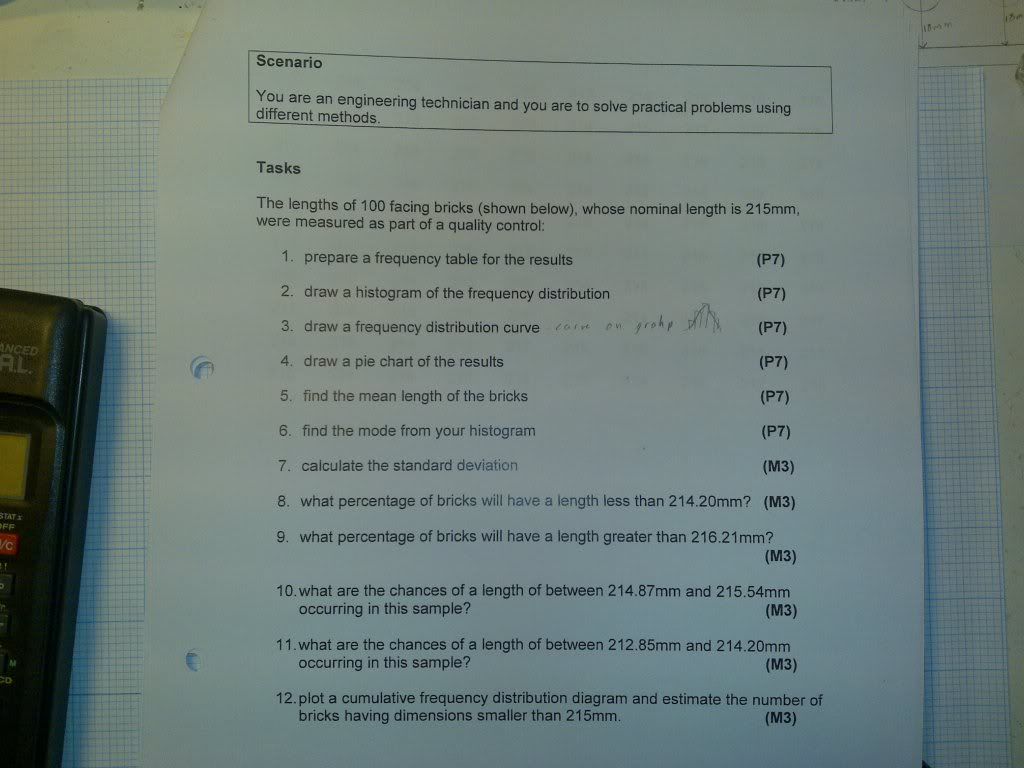
done most of this assignment but am stuck on 8-11
heres what ive got so far - www.laser-man.co.uk/test/assessment4.docx
here are the questions
Eat Sleep Lase Repeat
Senior Member
Here you go; see attached:
Done in rough and in a rush, so may be the odd error or two. I hope you can read my scribbles. I took your values of the standard deviation and the mean to be correct - I didn't work those out again.
Let me know if you want any parts explaining.
Hope that helps,
Dan

Last edited by danielbriggs; 04-02-2009 at 15:01. Reason: Ahh shit... forgot the attachments!
Senior Member
If you have a Texas Instruments calculator it will do most of this for you
Life is short.... Ride it hard!!
Senior Member
Daneil,
Im half following and understanding.
214.20 214.87 / 0.67212 = 0.9968
Its the next bit i dont understand
1 something (0.9968)
Also where did 0.8413 come from??
Eat Sleep Lase Repeat
Senior Member
OK, the Z value (-0.9968) comes from the normal distribution part, and we use statistical tables to look up the corresponding probability value (as the formula is complicated). But you can only look up positive values in the tables.
To find the positive value of Z we can do (1 - z) this gives us a useable number we can look up.
Then whizz down the stats table for a normal distribution and look up the 'phi' value (or as close to as possible.
A Z value of 1 in the table gives us a phi value of 0.8413 i.e. 84%, but we need to do 1-phi(z) = 0.1587 = 15.87%
Does that make sense, it's hard to understand and I'm crap at explaining things...
There are other ways to do this, but I find this the quickest and it's the way I've always done it.
Dan
Senior Member
Here's the table: (attached)
or you could use something like this: http://www.math.unb.ca/~knight/utility/NormTble.htm
But I prefer the format of the one attached
Senior Member
yeah makes sense, just aint the way the tutor did it.
he used or drew a new histogram chart and did it from that.
but thanks ill work on this
Eat Sleep Lase Repeat

 Posting Permissions

 Reply With Quote